Measure what happened. Learn what changed. Predict what works next.
SignalVII builds Atlas for mobile OOH operators who need proof they can stand behind and better next decisions.
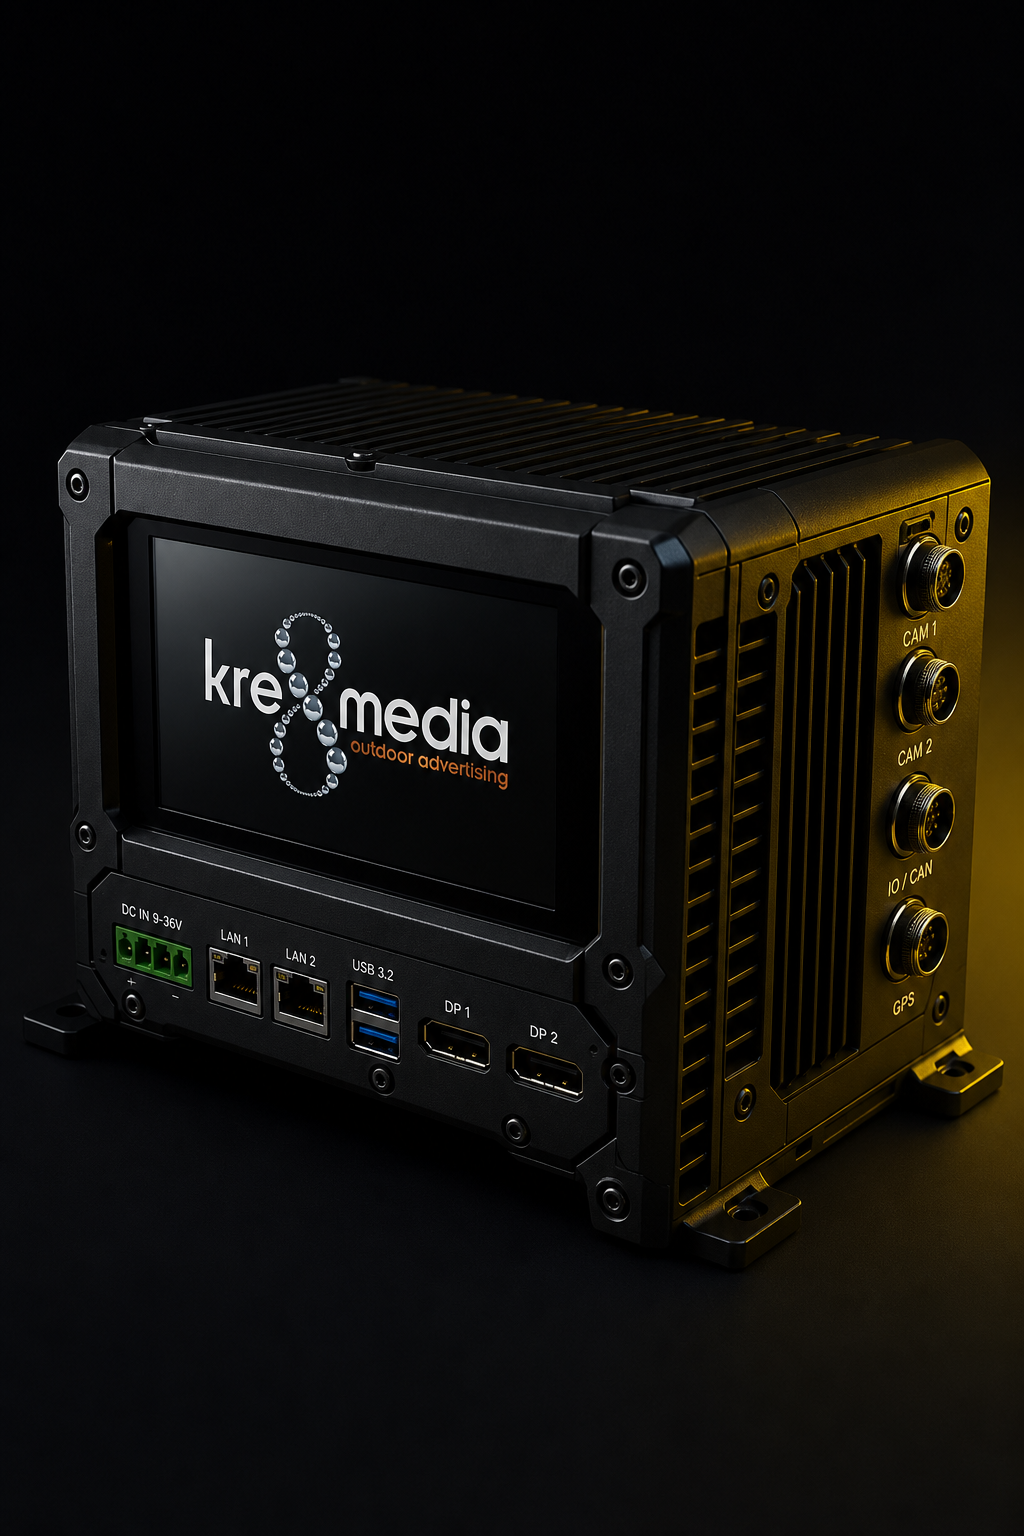
The system starts at the truck itself.
Atlas is not a recap layer built from distant estimates. It starts with the media asset, measures what happened around it, and turns that into something operators can actually use.

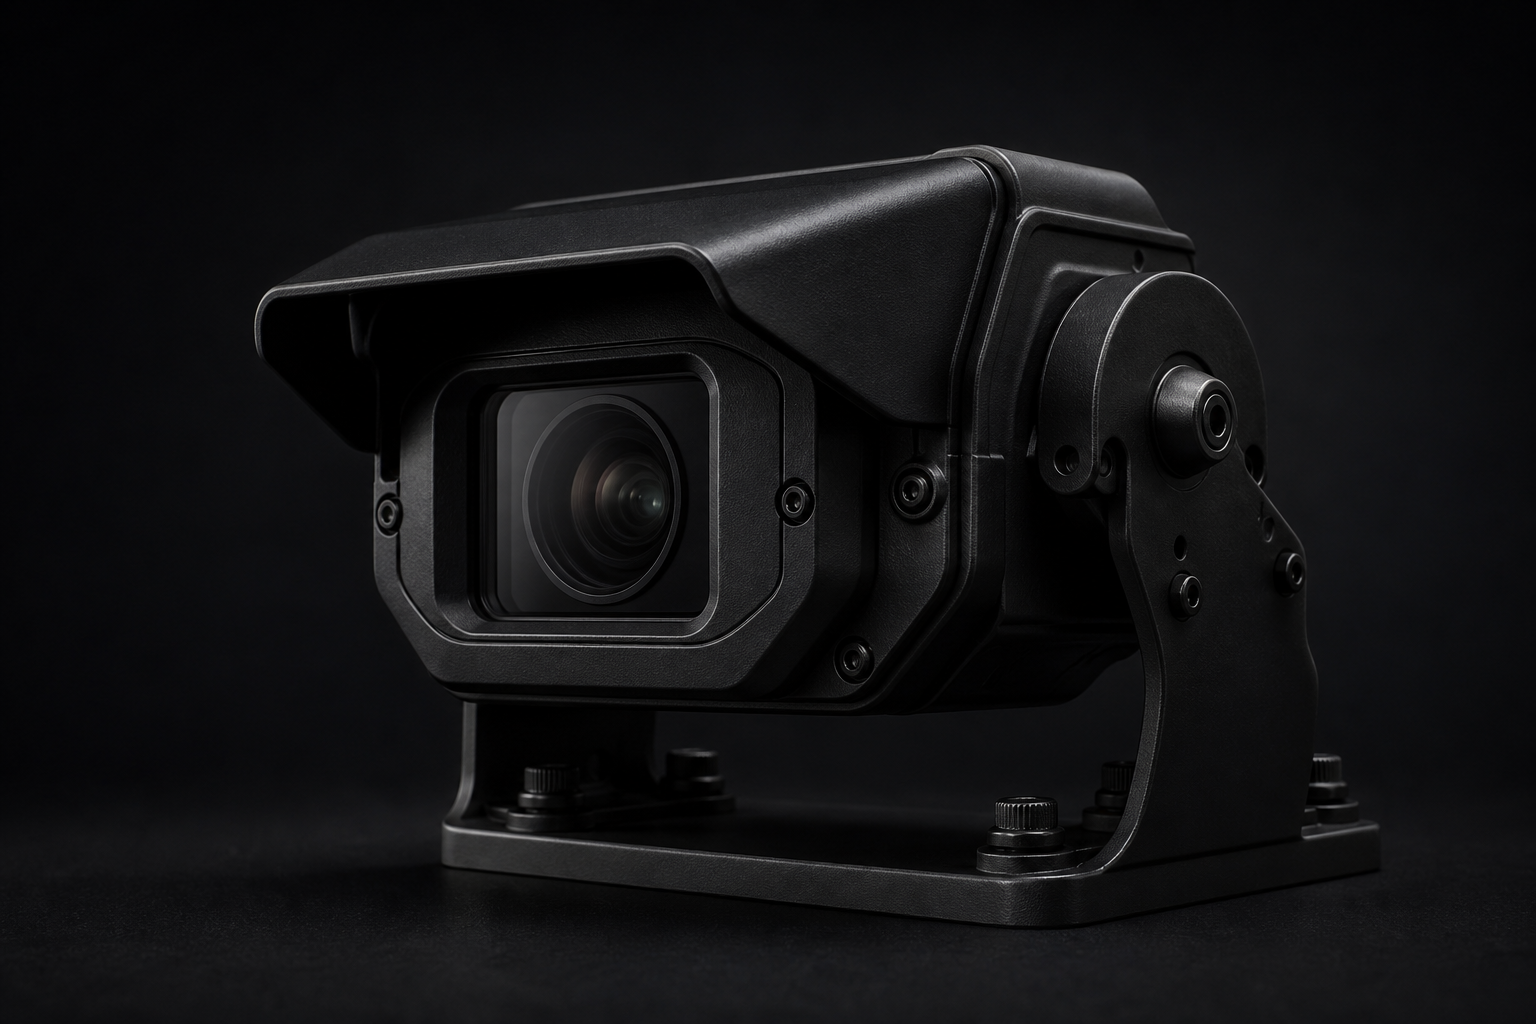
Mobile OOH is still being sold with proof operators cannot fully defend.
Current measurement can produce a report without proving what actually happened around the truck and ad.
- Phone-panel systems infer likely presence from devices seen near a route.
- Bluetooth systems get closer, but still rely on filtering, deduplication, and device-to-person approximation.
- Modeled systems turn traffic, venue assumptions, and route averages into audience numbers without showing the scene itself.
- Truck photos prove presence. GPS proves route. Neither proves what actually happened around the ad.
Then the client asks a simple question.
How do you know?
That is where current market still gets weak.
Atlas is one product with four layers.
Simple enough to explain. Strong enough to change what operators can sell.
Truck Truth
Atlas starts at the truck itself. Not estimated presence from somewhere else. Observed campaign reality.
City Intelligence
Connect each run to events, weather, traffic, tourism, release timing, neighborhood flow, and local city conditions.
Learning
Every campaign becomes an experiment. Every truck becomes a research platform. Atlas learns what changed.
Prediction
Turn learned patterns into evidence-weighted recommendations about where to run, when to run, and what to avoid.
Current market often gives operators numbers. Atlas gives operators answers.
Atlas changes what operators can sell: measured exposure, campaign explanation, accumulated learning, and stronger next decisions.
Why did this route work?
Measure what happened around the truck and ad instead of relying on recap language and assumptions.
Why did that one underperform?
Connect the run to the conditions that helped, hurt, or changed the result.
What changed from prior run?
Compare repeated routes, times, creative, and city conditions so differences become visible.
What should happen next?
Use observed truth and learned patterns to make stronger next campaign decisions.
You do not need another estimate. You need the truth.
Request Demo